
Introduction: The Morning the Lights Flickered from Chicago to Miami
Just before eight o’clock on the morning of Wednesday, July 22, 2026, something strange happened to the electricity flowing through tens of millions of American homes. In kitchens outside Chicago, refrigerator compressors groaned and restarted. In office towers in Philadelphia, fluorescent lights dimmed, brightened, and dimmed again. In suburban basements from Boston to Miami, the small wall-plug sensors of a fire-prevention monitoring network — devices that sample household voltage millions of times per second — began recording something their operators had rarely seen at such scale: voltage and current swinging rhythmically, repeatedly, across a footprint spanning nearly a third of the continental United States.[3] There was no storm. No transformer had exploded. No cyberattack was underway. The proximate cause was almost banal: a piece of equipment had failed on a single high-voltage transmission line operated by Dominion Energy in northern Virginia.[3][4] On any grid of the twentieth century, such a fault would have been cleared by protection relays in a fraction of a second and forgotten by lunchtime. Instead, the disturbance propagated for more than ten minutes across the territory of PJM Interconnection, the regional transmission organization serving 67 million people across thirteen states and the District of Columbia, before operators wrestled the system back into equilibrium.[1]
The reason the twenty-first-century grid behaved so differently from its twentieth-century ancestor is the subject of this paper. The epicenter of the July 22 event was not a power plant. It was “Data Center Alley” in Ashburn, Loudoun County, Virginia — the densest concentration of computing infrastructure on Earth, with more than two hundred facilities in a single county — and the machines that reacted to the transmission fault were not generators but servers.[3] When the voltage on the local network sagged for a few tens of milliseconds, the protection and control systems inside dozens of datacenter campuses did exactly what they were designed to do: they detected a power-quality anomaly, transferred their loads onto batteries and backup systems, and electrically walked away from the grid. Dominion Energy was emphatic on this point in its public statements. The utility did not disconnect anyone; the customers disconnected themselves.
“the data centers’ own control systems transferred them to backup power for a very short period of time.”
— Dominion Energy spokesperson [3]
In the language of grid operations, more than 3 gigawatts of demand — approximately 3.1 GW by PJM’s own operational data, about 3 percent of the entire interconnection’s load at that moment, and enough electricity to power several mid-sized cities — simply vanished from the system in about thirty seconds.[1][2] Because the grid must balance supply and demand continuously and nearly perfectly, the sudden disappearance of that much consumption left a surplus of generation with nowhere to go. Frequency rose. Voltage surged. Protection systems across a thousand-mile footprint sensed the swell, and the electrical shockwave that began with servers fleeing a voltage sag became, itself, a second disturbance — one measured by Ting Labs’ network of 1.4 million residential sensors as far west as Chicago.[2][4] Bob Marshall, the chief executive of Ting Labs, whose wall-plug devices first flagged the anomaly, summarized the physics with engineer’s understatement.
“The power quality took a pretty big hit.”
— Bob Marshall, CEO, Ting Labs (to Reuters) [1]
This paper takes the July 22, 2026 event as its baseline and its warning. The event is important not because of what happened — the system held, safety equipment performed as designed, and there was no widespread blackout — but because of what it revealed about the trajectory we are on. The mass disconnection of July 2026 was twice as large as a nearly identical event on July 10, 2024, when sixty data centers in the same region simultaneously dropped roughly 1.5 GW of load in response to a lightning-arrestor failure on a 230 kV line.[2][5][6] In the two years between the two events, data center demand on PJM grew relentlessly; by 2040, data centers are projected to constitute roughly 24 percent of PJM’s load, up from about 6 percent at the time of the 2024 incident.[2] If the size of the correlated load that can vanish in thirty seconds doubles every two years while the grid’s underlying inertia and reserve margins erode, then simple extrapolation — 3 GW in 2026, 6 GW by 2028, 12 GW by 2030 — carries the system past the largest contingencies it was ever designed to survive. Somewhere along that curve lies the first true compute-driven blackout.
The transformation underlying this risk can be stated in one sentence: AI datacenters have transitioned from passive baseload consumers into active, high-velocity grid participants. For a century, the demand side of the power system was the boring side. Loads were diffuse, statistically smooth, thermally sluggish, and blissfully unaware of one another; a million toasters do not coordinate. Grid engineering therefore concentrated its contingency planning on the supply side, where the sudden loss of a large generator or a major transmission corridor represented the worst credible instantaneous shock. That asymmetry is now gone. A single hyperscale AI campus can draw as much power as a nuclear reactor produces; its consumption can swing by hundreds of megawatts in seconds as training jobs start, checkpoint, crash, and restart; and its protection systems can disconnect the entire facility from the grid in milliseconds, autonomously, without a human decision and without informing the grid operator in advance.[8][13][33] As NERC — the North American Electric Reliability Corporation, the body responsible for the reliability of the bulk power system — observed in its formal review of the 2024 precursor event, the system has simply never faced this before.
“The electric grid has not historically experienced simultaneous load losses of this magnitude” in response to a system fault.
— NERC, Incident Review, January 2025 [9]
Why “Compute Stampede”: Naming the Phenomenon
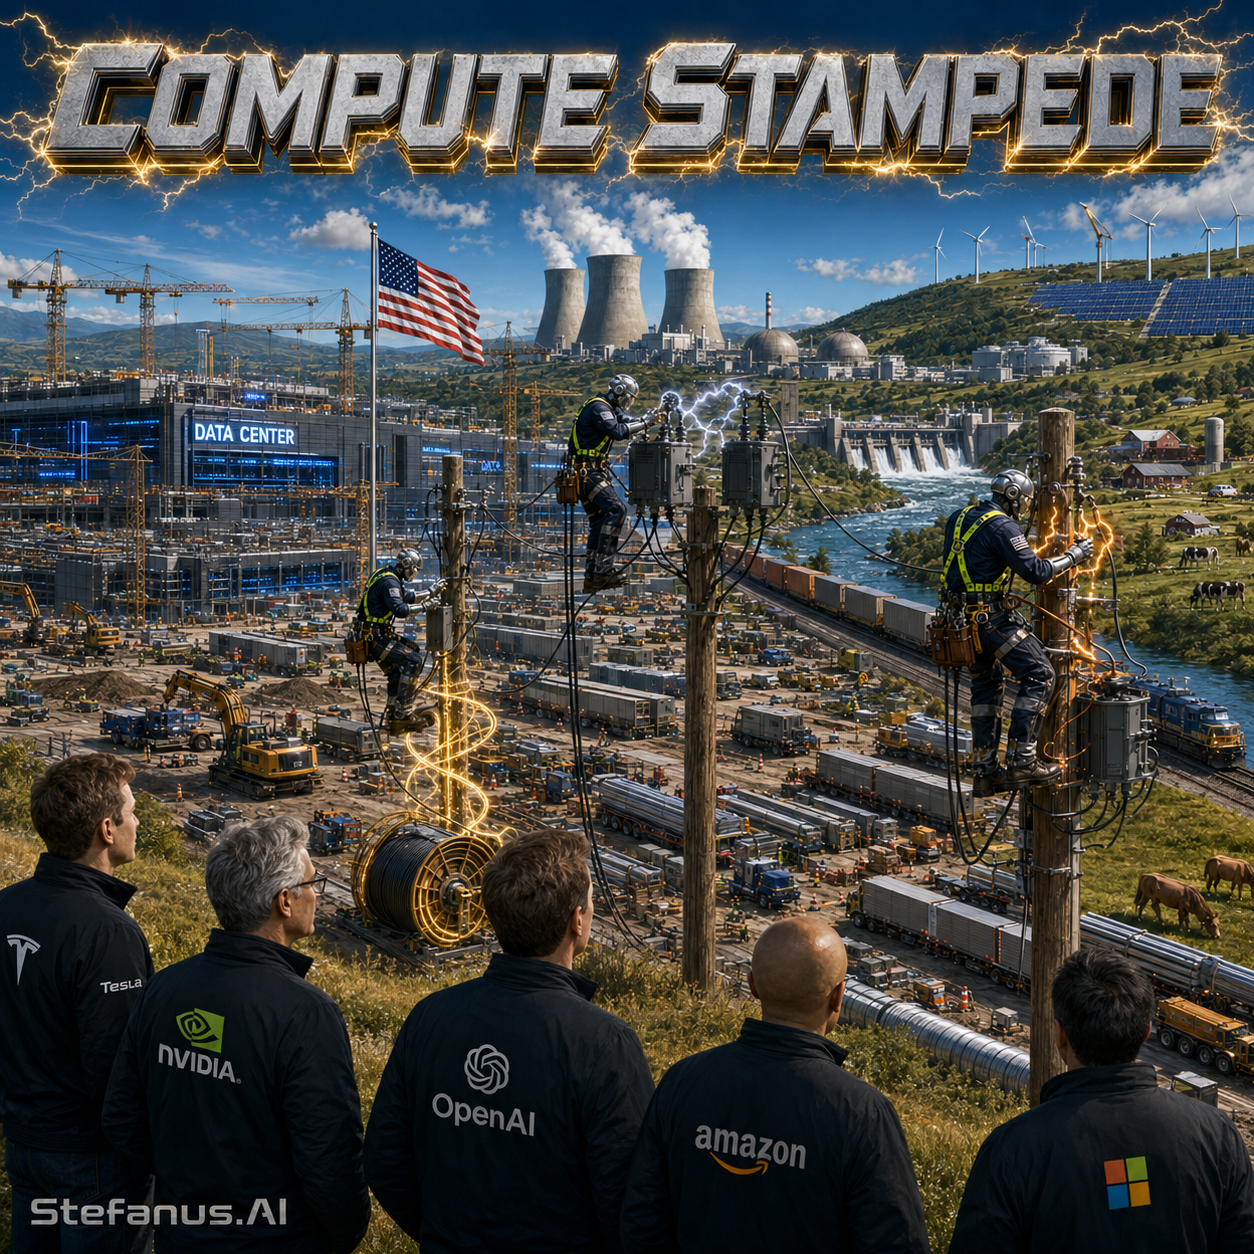
Every systemic risk that has ultimately been governed well was first named well. “Bank run,” “flash crash,” “cascading failure,” “common-mode fault” — each phrase compressed a complex dynamic into an image vivid enough to organize regulation, engineering, and public understanding around it. I have chosen “Compute Stampede” as the title of this paper, and as the name of the framework it proposes, for five deliberate reasons.
First, a stampede is a phenomenon of herds, not individuals, and that is precisely the point. No single datacenter behaved improperly on July 22, 2026. Each facility’s UPS transfer was locally rational, locally protective, and locally compliant with its service-level obligations. The danger emerged only from the correlation — from the fact that hundreds of facilities, built from the same server power supplies, the same UPS firmware, the same protection thresholds, and the same orchestration software, made the same split-second decision at the same instant. Like wildebeest on a plain, each animal runs sensibly from a perceived threat; it is the synchronized running of the herd that tramples everything in its path.
Second, a stampede is triggered by a small stimulus and amplified by reflex. A snapped twig can move a thousand animals; a failed lightning arrestor or a downed conductor — events the grid experiences routinely and was always able to absorb — can now move three gigawatts. The disproportion between trigger and response is the signature of the phenomenon, and “stampede” captures that disproportion in a way that a sterile phrase like “correlated load rejection event” never will.
Third, a stampede has two dangerous phases: the flight and the return. The mass disconnection is only half the risk. The other half — analyzed at length in Section 4 — is the rebound: the moment when gigawatts of computing load, having ridden out the disturbance on batteries and diesel, attempt to return to the grid, potentially simultaneously, onto a system still nursing its wounds. NERC’s own analysis of the 2024 event warned explicitly that reconnection ramp rates are as critical to system operations as generation ramping.[5][9] A herd that flees together tends to return together, and the ground must bear both crossings.
Fourth, the word “compute” locates the cause precisely. This is not a story about electricity demand in general, or about industrial growth in the abstract. It is a story about the specific physical character of computation as a load: silicon that transitions between near-idle and thermal-design-power in milliseconds, orchestration software that synchronizes tens of thousands of GPUs into lockstep training iterations, and protection electronics that guard multi-billion-dollar chip inventories with hair-trigger sensitivity.[13][15] The stampede is not incidental to AI computing; it is an emergent property of how AI computing works.
Fifth, and finally, “Compute Stampede” is chosen because it implies its own remedy. Stampedes are managed in the physical world not by eliminating herds but by engineering their environment — fences, chutes, staggered gates, early-warning outriders. The policy framework proposed in this paper follows exactly that logic: staggered reconnection windows, ride-through fencing, telemetry outriders between cluster managers and control rooms, and buffering that absorbs the herd’s momentum before it reaches the bulk system. The name is the framework.
Thesis and Roadmap
The thesis of this paper is that uncoordinated server-grid interactions — synchronized disconnections, voltage-disturbance amplification, and machine-load rebounds, operating at gigawatt scale and millisecond speed — now constitute a systemic threat to bulk power system stability that existing planning, protection, and market frameworks were never designed to contain, and that a new mandatory control framework, the Compute Stampede Standard, is required at the interface between hyperscale computing and the electric grid.
The argument proceeds in eight movements. Section 1 reconstructs the July 22, 2026 event minute by minute — the “Ten-Minute Shock” — and situates it within the lineage of precursor events in Virginia, Texas, and Ireland from 2023 through 2025. Section 2 descends into the server rack to examine the physics of the stampede: GPU state transitions, power supply unit ride-through characteristics and the ITIC/CBEMA voltage-tolerance envelope, and the rebound mechanism embedded in automated restart logic. Section 3 moves to the grid side, examining initiating events, the mechanisms by which a local fault in Loudoun County becomes a multi-state disturbance, and the erosion of rotational inertia that makes the modern grid progressively more brittle against exactly this class of shock. Section 4 confronts the synchronization problem directly — why standardized hardware and software across competing companies produce correlated behavior indistinguishable, from the control room, from a coordinated attack — and assembles the full threat matrix of cascading failure, including harmonic and sub-synchronous interactions and the self-reinforcing loop effect. Section 5 catalogs the regulatory, operational, and architectural blind spots, from the historic absence of NERC standards for large loads to the visibility gap in RTO control rooms and the paradox by which green power purchase agreements mask physical volatility. Section 6 presents the engineering solutions — hardware buffering, software-defined staggering, and dynamic demand-response telemetry — and welds them into the proposed Compute Stampede Standard. Section 7 examines the political and national-security implications, explaining why FERC, NERC, state governors, utilities, NVIDIA, the hyperscalers, and equipment manufacturers must now treat AI load behavior as critical infrastructure in its own right. Section 8 distills the lessons into seven pillars, and the Conclusion returns to the July 2026 event as a structural warning — and to the achievable future in which datacenters become the grid’s shock absorbers rather than its largest single vulnerability.

Section 1: The Ten-Minute Shock — Anatomy of the July 22, 2026 PJM Disconnection Event
Every discipline has its Galveston, its Northeast Blackout of 1965, its Flash Crash of 2010 — the event that converts a theoretical vulnerability into an empirical fact and reorganizes the field around it. For the study of large computational loads, that event occurred between approximately 7:50 and 8:05 a.m. Eastern time on July 22, 2026. Reconstructing it precisely matters, because the details — the thirty-second collapse, the partial recovery, the second wave of disconnections, the 3.49 GW peak surplus, the eleven-minute stabilization — each illuminate a different facet of the stampede dynamic that the remainder of this paper analyzes.
1.1 The Reconstruction
The sequence began, as these sequences almost always begin, with mundane equipment failure. A component failed on one of Dominion Energy’s high-voltage transmission lines serving the Ashburn area of Loudoun County — the heart of Data Center Alley.[3][4] The line tripped out of service. In the affected pocket of the network, voltage sagged as the system redistributed power flows around the lost corridor. For the residential and commercial customers of northern Virginia, this would have registered — if it registered at all — as a barely perceptible flicker, the kind the grid produces and absorbs thousands of times a year.
For the datacenters of Loudoun County, however, the sag crossed a programmed threshold. Facility protection and control systems — the layered architecture of server power supplies, uninterruptible power supply systems, static transfer switches, and campus-level controllers described in Section 2 — classified the disturbance as a power-quality threat and executed their designed response: an automatic, near-instantaneous transfer of computing and cooling load onto backup power. Crucially, they did so together. Because the facilities share the same vendor ecosystems, the same voltage-tolerance curves, and the same conservative protection philosophy, the voltage sag functioned as a common-mode signal — a starter’s pistol heard simultaneously across dozens of campuses. According to PJM operational data reported by TechCrunch, approximately 3.1 gigawatts of load vanished from the grid in roughly thirty seconds.[2]
What happened next is, for the purposes of this paper, the most instructive part of the event. The grid appeared to begin recovering — and then a second tranche of load dropped off.[2] This two-wave structure is the fingerprint of the loop effect analyzed in Section 4.3: the initial mass disconnection itself perturbed voltage and frequency across the region, and that second perturbation crossed the protection thresholds of additional facilities that had ridden through the first. The stampede, in other words, recruited its own reinforcements. At its peak, PJM’s system was carrying approximately 3.49 gigawatts of excess supply — generation with no load to serve — and it took a further eleven minutes for operators to stabilize the system, removing shunt capacitor banks, redispatching units, and letting governor response and automatic generation control claw frequency back to 60.000 Hz.[2] PJM confirmed the load drop and the associated frequency excursion while emphasizing that reliability was never lost.[1] Millions of customers from Chicago to Boston to Miami experienced roughly ten minutes of flickering, sagging, and surging power.[3]
Table 1. Reconstructed timeline of the July 22, 2026 PJM “Ten-Minute Shock” (times approximate, compiled from PJM operational data and press reconstruction).[1][2][3]
| Phase | Approx. Time | Event | System Consequence |
| T0 — Trigger | ~7:50 a.m. ET | Equipment failure trips a Dominion high-voltage transmission line near Ashburn, VA | Localized voltage sag lasting tens of milliseconds; routine fault by historical standards |
| T1 — Flight | T0 + ~30 sec | Datacenter protection systems across Loudoun County transfer ~3.1 GW to backup power nearly simultaneously | ~3% of PJM demand vanishes; frequency rises; voltage begins to surge across the region |
| T2 — False Recovery | T0 + ~1–2 min | Grid begins to rebalance; operators respond to over-voltage and over-frequency | Partial stabilization; disturbance continues propagating outward through the network |
| T3 — Second Wave | T0 + ~2–4 min | Additional load disconnects in response to the disturbance created by the first wave | Excess supply peaks at ~3.49 GW; voltage oscillations measured from Washington, D.C. to Chicago |
| T4 — Stabilization | T0 + ~11–15 min | Operators remove capacitor banks, redispatch generation; frequency and voltage settle | System stable; no blackout; power-quality disturbance recorded on 1.4 million residential sensors |
1.2 The Lineage: This Was Not the First Stampede
The July 2026 event was the largest of its kind, but it was emphatically not the first, and its predecessors form a dataset that transforms anecdote into trend. The direct precursor occurred on July 10, 2024, at approximately 7:00 p.m. Eastern, in the same region of the Eastern Interconnection. A lightning arrestor failed on a 230 kV transmission line, producing a permanent fault that locked the line out — but not before the automatic reclosing sequence attempted to restore it repeatedly, generating six sequential faults within 82 seconds, each lasting between 42 and 66 milliseconds, with voltage depressions of 0.25 to 0.40 per unit in the affected area.[10] Sixty data centers, spread across sixty measurement points and twenty-five substations, responded by transferring approximately 1,500 MW to backup power almost simultaneously.[6][7] Frequency rose to 60.047 Hz; voltage climbed to 1.07 per unit before operators could remove capacitor banks; and — in a detail with profound implications for the rebound analysis of Section 4 — roughly 1,260 MW of that load stayed off the grid for hours, its return governed not by grid conditions but by datacenter control logic that counts voltage disturbances within a time window before deeming the grid trustworthy again.[5][9][10]
Nor is the phenomenon confined to Virginia. In Texas, ERCOT documented twenty-five to twenty-six large-load ride-through failure events between late 2023 and September 2025, predominantly involving cryptocurrency-mining facilities shedding between 100 and 400 MW per disturbance; NERC’s January 2026 review of these events found that such facilities can lose between 17 and 95 percent of their pre-disturbance consumption within milliseconds of a normally cleared transmission fault.[7][20] Individual facilities have been documented dropping from 450 MW to 40 MW in 36 seconds, and shedding 298 MW in 25 seconds — ramp rates that outrun the regulation reserves grid operators carry.[11] Across the Atlantic, in May 2025, a remote transient fault in Ireland caused 387 MW of data center load to drop instantly — fully 52 percent of all data center demand on the island at that moment — forcing EirGrid to activate emergency stability measures in a system that had already imposed a moratorium on new datacenter connections around Dublin.[12][17] The pattern is global, recurring, and accelerating in magnitude.
Table 2. Documented large-load disconnection events, 2023–2026 — the empirical lineage of the Compute Stampede.[2][5][7][11][12][20]
| Event / Period | Region | Magnitude | Trigger | Key Lesson |
| Crypto-load ride-through failures, Nov. 2023 – Sept. 2025 (25–26 events) | ERCOT (Texas) | 100–400 MW per event; 17–95% of facility load lost in milliseconds | Normally cleared transmission faults | Large electronic loads routinely fail to ride through routine faults |
| July 10, 2024 Eastern Interconnection event | Northern Virginia (PJM) | ~1,500 MW across 60 points / 25 substations; ~1,260 MW stayed off for hours | Lightning arrestor failure; 6 faults in 82 seconds via auto-reclosing | Reclosing logic interacts with datacenter disturbance-counting protection; uncontrolled reconnection risk identified by NERC |
| May 2025 EirGrid event | Ireland | 387 MW instantly — 52% of national datacenter demand at that moment | Remote transient fault | Small systems face proportionally existential exposure; FRT requirements for loads emerge in Europe |
| July 22, 2026 PJM event (“Ten-Minute Shock”) | Northern Virginia → 13-state PJM footprint | ~3.1 GW in ~30 seconds; 3.49 GW peak surplus; ~3% of PJM demand; 10–11+ minutes to stabilize | Single transmission line equipment failure | Doubling of event magnitude in two years; two-wave structure demonstrates the self-amplifying loop effect |
Three features of this lineage deserve emphasis before we descend into the physics. First, the doubling: 1.5 GW in 2024, 3.1 GW in 2026, on the same grid, from the same class of trigger. Second, the asymmetry of attention: every one of these events was a load-loss event, not a load-surge event — the defining disturbances of this era are demand disappearing, not demand appearing, which inverts a century of contingency planning oriented around losing generators.[11] Third, the invisibility: in each case, the balancing authority did not know, in advance and in real time, that this behavior was embedded in its load. The 1,500 MW response of 2024 “was not anticipated by the BES operators,” in NERC’s words, because nothing in the interconnection process, the planning models, or the operational telemetry captured the protection logic sitting behind the meter.[5][10] The stampede was, and largely remains, a phantom contingency — present in the system, absent from the models.

Section 2: The Physics of the Stampede — Inside the Server Rack
To understand why three gigawatts of demand can vanish in thirty seconds, one must abandon the grid operator’s aggregated view and descend into the machine room — down through the campus switchgear, past the uninterruptible power supplies, into the rack, onto the board, and finally into the silicon itself. The Compute Stampede is not a grid phenomenon that happens to involve computers; it is a computing phenomenon that happens to express itself on the grid. Its physics originate in three nested layers: the dynamic power profile of AI accelerators, the protection philosophy of server power infrastructure, and the automated restart logic that governs the rebound. This section examines each in turn, because every element of the policy framework proposed later in this paper corresponds to a specific physical mechanism identified here.
2.1 Dynamic Power Profiles: Silicon That Moves in Milliseconds
The workhorse of the AI era — the GPU or custom AI accelerator — is, from the electrical engineer’s standpoint, one of the most volatile loads ever mass-deployed. A modern training-class accelerator idles at a small fraction of its thermal design power and can transition to full power, seven hundred watts to over a kilowatt per device, in milliseconds when a compute kernel launches. This would be unremarkable if devices acted independently; a warehouse of uncorrelated processors averages into a smooth aggregate, just as a city of uncorrelated toasters does. But large-scale AI training destroys that independence by design. Distributed training jobs spanning tens of thousands of GPUs operate in tightly synchronized iterations: a compute-heavy phase in which every GPU processes its local shard of data at close to thermal limits, followed by a communication-heavy phase in which all GPUs exchange gradients and synchronize — during which power consumption falls toward idle.[13][15] The result, documented in production telemetry by the joint Microsoft–OpenAI–NVIDIA research team in their August 2025 paper “Power Stabilization for AI Training Datacenters,” is a facility-scale power waveform that oscillates between near-idle and near-peak with every training iteration — tens to hundreds of megawatts swinging rhythmically, at frequencies determined not by any electrical process but by batch sizes, network topologies, and collective-communication algorithms.[13][14]
The amplitude of these swings grows with the size of the training job, and their frequency spectrum is what most alarms utility engineers. The Microsoft–OpenAI–NVIDIA team warned that the periodic power oscillations of synchronized training fall into ranges that can interact with the electromechanical resonances of the power system itself — the sub-synchronous regime and the 0.1–20 Hz band in which inter-area oscillations and turbine-generator shaft modes live — raising the possibility that a sufficiently large training cluster could excite mechanical resonance in generation equipment dozens or hundreds of miles away.[13][15]
AI training power swings, “if harmonized with critical frequencies of utilities, can cause physical damage” to grid infrastructure.
— Choukse et al., Microsoft–OpenAI–NVIDIA, “Power Stabilization for AI Training Datacenters” [13]
Beyond training oscillations, the operational envelope of an AI campus includes step changes that dwarf anything traditional industry produces at comparable speed: a training job crashing and dropping hundreds of megawatts instantly; a job launching and ramping a campus from partial to full load in seconds; inference fleets breathing with global user demand. Industry practitioners describe the phenomenon plainly.
“Power demand can fluctuate by hundreds of megawatts in seconds” as large workloads start or stop.
— Ryan Westfall, quoted in Data Center Knowledge [33]
Academic characterization has kept pace. Professor Le Xie of Harvard University and colleagues at Texas A&M, in their comprehensive 2025–2026 survey of AI datacenter grid impacts, document the distinct electrical signatures of model preparation, training, fine-tuning, and inference, and conclude that at scale, power-electronics-based AI computing loads pose major threats to grid stability and power quality — threats amplified by the geographic clustering of facilities in regions with cheap power and favorable policy.[17] Professor Aoife Foley and Dr. Dlzar Al Kez, in time-domain simulations of a modified New England test system published in 2025 and profiled by SSRN in May 2026, demonstrated something even more striking: rapid AI training ramps in inverter-dominated grids can trigger voltage depressions, rate-of-change-of-frequency spikes, and system-wide instability even without any generator fault at all — a new class of purely demand-driven disturbance.[16]
“AI data centres are no longer passive electricity consumers.”
— Prof. Aoife Foley and Dr. Dlzar Al Kez, “Instability Risks from Programmable AI Load Ramping in Low-Inertia Grids” [16]
2.2 Server Power Supply Units, UPS Architecture, and the ITIC/CBEMA Envelope
If the silicon supplies the volatility, the power-protection stack supplies the trigger mechanism. Every server in a modern datacenter is fed through a chain of power electronics: a switch-mode power supply unit (PSU) in the server itself; rack- or row-level power distribution; and, standing between the facility and the grid, uninterruptible power supply (UPS) systems backed by batteries and, behind them, diesel or gas generators for sustained outages. Each layer embodies a voltage-tolerance philosophy descended from the ITIC curve (formerly the CBEMA curve) — the industry-standard envelope, maintained by the Information Technology Industry Council, that defines how deep and how long a voltage sag information-technology equipment must tolerate without malfunction. The canonical envelope is generous at the extremes — equipment must ride through a complete voltage interruption of up to 20 milliseconds, and sags to 70 percent of nominal voltage for up to half a second — but the crucial institutional fact is that the ITIC curve was written to protect the equipment, not the grid. It defines when a server may give up on utility power; it says nothing about what a gigawatt of servers giving up simultaneously does to everyone else.
Table 3. Simplified voltage-disturbance tolerance envelope for IT equipment (ITIC/CBEMA-derived), contrasted with observed datacenter protection behavior in the 2024–2026 events.[5][10][12]
| Disturbance | Typical ITIC-Style Tolerance | Observed Fleet Behavior in Events | Grid Consequence |
| Momentary interruption (0 V) | Ride through up to ~20 ms | UPS transfer initiated near-instantaneously on detection | Load leaves grid even for disturbances equipment could survive |
| Sag to ~70% of nominal | Ride through up to ~0.5 s | Campus-level transfer at 0.25–0.40 p.u. depressions lasting 42–66 ms (2024 event) | 1,500–3,100 MW of simultaneous load rejection |
| Repeated sags (reclosing sequences) | Not addressed by ITIC | Disturbance-counting logic locks facilities onto backup after N events in a window | Load stays off grid for hours; uncontrolled mass reconnection risk |
| Over-voltage following mass load loss | Ride through brief swells to ~110–120% | Second-wave disconnections observed (July 2026) | Self-amplifying loop effect; disturbance recruits additional disconnections |
The engineering culture of the datacenter industry compounds the conservatism. A hyperscale facility exists to deliver “five nines” of availability under contractual service-level agreements measured in millions of dollars per hour of downtime, while housing GPU inventories whose replacement cost now rivals the facility shell itself. Facility engineers therefore tune protection to transfer to backup early and often — the UPS is there, the batteries are charged, and the transfer is free from the facility’s perspective. As NERC documented in its incident review, datacenter loads are sensitive to voltage disturbances by design, and their protections and controls are engineered to avoid equipment outages, with cooling systems — chillers, pumps, computer-room air handlers — equally critical and equally voltage-sensitive; a modern AI hall operating at 100+ kW per rack can survive only minutes of cooling interruption before thermal runaway forces shutdown.[9] Critically, traditional UPS logic is asymmetric in time: it transfers to battery in milliseconds, but it does not transfer back until the grid has been continuously stable for a defined observation period.[12] The 2024 Virginia event exposed the most consequential refinement of this logic: protection schemes that count the number of voltage disturbances within a specified window and, upon reaching the threshold, commit the facility to backup power for an extended period — which is precisely how six reclosing-driven faults in 82 seconds converted a single failed lightning arrestor into 1,260 MW of load that stayed off the grid for hours.[5][10]
Step back and observe what this stack amounts to at fleet scale. Thousands of facilities, engineered by a handful of vendors to a common tolerance envelope, monitoring the same grid, applying the same thresholds, with the same asymmetric transfer logic. The individual design is impeccable. The collective design is a hair trigger distributed across a thousand miles — and nobody designed the collective at all.
2.3 The Rebound Mechanism: Automated Restarts and the Second Front
The stampede’s second front opens when the herd turns around. Datacenter backup power is a bridge, not a destination: batteries carry the load for minutes, generators for hours or days, and economics, emissions permits, and fuel logistics all push facilities to return to utility power as soon as their control logic deems the grid trustworthy. Herein lies the rebound mechanism, and it operates at two timescales.
At the electrical timescale, reconnection is a load-inrush event. Retransferring a campus from backup to utility re-energizes transformers, restarts chiller compressors, and re-applies hundreds of megawatts of demand to the local network in seconds. NERC’s formal warning on this point, issued after the 2024 event, is the founding text of rebound risk: while that incident happened not to produce reconnection problems, the potential exists for serious issues in future incidents if load is not reconnected in a controlled manner, because significant amounts of load reconnecting simultaneously present challenges to balancing authorities and transmission operators — and ramp rates for load connection are just as critical to system operations as generation ramping.[5][9] A grid that has spent ten minutes shedding excess generation to absorb a 3 GW load loss is maximally unprepared to receive that 3 GW back in one gulp; the rebound would be, functionally, a second contingency of equal magnitude and opposite sign, striking a system with depleted reserves and operators mid-recovery.
At the computational timescale, the rebound is sharpened by software. When power events interrupt AI training, orchestration layers — Kubernetes-class cluster managers, job schedulers, checkpoint-restore systems — are engineered to resume work automatically and aggressively: reloading model checkpoints from storage (an I/O- and power-intensive burst), re-establishing collective communication across tens of thousands of GPUs, and relaunching compute kernels that drive every device from idle toward thermal design power within the same synchronized iteration structure described in Section 2.1.[13][15] The software has no concept of the grid’s convalescence; it optimizes for GPU-hours, and every scheduler in every facility affected by a regional event will race to reclaim them at once. The result is a correlation engine layered on top of a correlation engine: protection logic synchronizes the flight, and orchestration logic synchronizes the return. The July 2024 event’s hours-long, staggered-by-accident reconnection was benign only because it was slow and uncoordinated; nothing in current standards guarantees it will remain either. This is the specific gap that Pillar 2 of the framework proposed in Section 8 — mandatory staggered recovery protocols, implemented at the firmware and orchestration level — exists to close.

Section 3: Grid-Side Triggers, Propagation, and the Erosion of Inertia
A stampede requires two ingredients: a nervous herd and a startling stimulus. Section 2 examined the herd — the millions of voltage-sensitive servers whose protection logic stands ready to bolt. This section examines the stimulus and the terrain across which the panic travels. It asks three questions in sequence: what kinds of grid events are large enough to trigger a fleet-wide response; how a disturbance confined to a few substations in Loudoun County becomes a power-quality event measured a thousand miles away in Chicago; and why the modern grid — having quietly replaced much of its spinning steel with silicon on both the supply and demand sides — is becoming structurally less able to absorb exactly this class of shock. The through-line is that the grid-side and server-side vulnerabilities are not independent problems that happen to coincide. They are coupled, and the coupling is tightening every quarter.
3.1 Initiating Events: How Little It Takes
The sobering lesson of the 2024 and 2026 events is the sheer ordinariness of their triggers. The grid is not a fragile thing; it experiences faults constantly — lightning strikes, tree contacts, animal intrusions, equipment aging, insulator flashovers — and its protection systems are designed to clear them in a few cycles, isolating the faulted element while the rest of the network rides through undisturbed. A single failed lightning arrestor triggered the 2024 stampede; a single piece of failed line equipment triggered the 2026 one.[3][10] Neither would have merited a footnote in a grid-reliability report of the 1990s. What has changed is not the frequency or severity of the triggers but the sensitivity of the load to them. When a fault depresses voltage to 0.25–0.40 per unit for 42 to 66 milliseconds — a disturbance the grid clears routinely and most industrial equipment shrugs off — the datacenter fleet interprets it as a command to evacuate.[10]
The taxonomy of triggers matters for defense. The most common are transmission faults and their associated protection actions, including the automatic reclosing sequences that, as the 2024 event demonstrated, can convert one fault into six and thereby trip datacenter disturbance-counting logic that a single fault would not.[10] A second category is localized voltage excursions from switching operations, capacitor-bank actions, or the loss of a nearby generator. A third, and increasingly discussed, category is deliberate: a targeted cyber-physical incident engineered to produce exactly the voltage signature that triggers mass load rejection. The Compute Stampede’s defining feature — that a small, cheap, physically local action can produce a large, systemic, geographically vast response — is precisely the asymmetry an adversary seeks. We return to this national-security dimension in Section 7; here it suffices to note that from the control room, a synchronized fleet disconnection triggered by a squirrel on a 230 kV line and one triggered by a coordinated attack look identical, and that indistinguishability is itself a vulnerability.
3.2 Geographic Propagation: From Loudoun County to Chicago
How does a disturbance rooted in a few dozen substations in northern Virginia come to flicker lights in Illinois and Florida? The answer lies in the tightly interconnected nature of the Eastern Interconnection and the physics of supply-demand balance. The grid is a single synchronous machine spanning most of the eastern United States and Canada; every generator on it spins in lockstep at 60 Hz, and the entire system shares one frequency at any instant. When 3.1 GW of load vanishes from one corner of that machine in thirty seconds, the immediate consequence is a system-wide imbalance: generation that was matched to demand a moment ago is now in surplus, and with less load drawing power through the network, two things happen at once, as NERC concisely explained after the 2024 event. First, frequency rises everywhere on the interconnection simultaneously, because the surplus of mechanical input over electrical output accelerates every synchronous generator on the system. Second, and more locally, voltage rises rapidly because less power is flowing through the transmission network, leaving reactive power — much of it supplied by capacitor banks sized for the pre-disturbance load — with nowhere to go.[9] The voltage rise is sharpest near the epicenter but propagates outward along transmission corridors, attenuating with distance and network impedance but remaining measurable, as Ting Labs’ residential sensor network demonstrated, across a footprint from Washington to Chicago.[2][4]
This propagation is what converts a local event into a systemic one, and it is why the datacenter question cannot be delegated to distribution utilities or handled campus by campus. The load that disconnects sits at the distribution or sub-transmission level, but its disappearance perturbs the bulk power system that everyone shares. The frequency excursion is, by definition, an interconnection-wide event: the 60.047 Hz peak of 2024 was seen by every meter from Maine to Florida to the eastern Dakotas.[16] A useful analogy is a crowd on a suspension bridge: one person jumping does nothing, but a few thousand pedestrians who happen to fall into step can set the entire span oscillating, and the oscillation is felt by everyone on the bridge, not merely by those who were marching. The datacenter fleet, synchronized by common protection logic, is the crowd that has fallen into step.
3.3 Rotational Inertia Erosion: Why the Ground Is Getting Softer
The final and most structural grid-side factor is the quiet erosion of rotational inertia. For more than a century, the grid’s frequency stability rested on a beautiful piece of accidental engineering: the enormous rotating masses of synchronous generators — the multi-ton steel rotors of coal, gas, nuclear, and hydro units — store kinetic energy and, by the simple physics of angular momentum, resist changes in frequency. When a large generator trips and frequency starts to fall, every other spinning machine on the system instantaneously and automatically donates a fraction of its rotational energy to arrest the decline, buying the seconds that governors and automatic generation control need to respond. This inertial response is not a control system; it is physics, free and instantaneous, and the grid’s entire hierarchy of frequency-stabilizing mechanisms was calibrated to the generous cushion it provides.
That cushion is thinning from both directions at once. On the supply side, synchronous generators are being retired and replaced by inverter-based resources — solar, wind, and batteries — which connect to the grid through power electronics and contribute little or no inherent inertia. On the demand side, the new giant loads are themselves inverter-based, drawing power through switch-mode electronics rather than the spinning induction motors that once dominated industrial demand and contributed their own modest inertial and damping effects. The Union of Concerned Scientists framed the resulting transition with unusual clarity in a March 2026 analysis.
“as inverter-based loads and resources grow, stability will depend increasingly on fast electronic control rather than rotating mass.”
— Lee Shaver, Union of Concerned Scientists [32]
The consequence for the Compute Stampede is direct and alarming. A grid with less inertia experiences larger and faster frequency excursions for a given power imbalance — a higher rate of change of frequency (RoCoF) — which means the same 3 GW load rejection produces a bigger frequency swing on the low-inertia grid of 2030 than on the higher-inertia grid of 2024. Professor Aoife Foley and Dr. Dlzar Al Kez modeled precisely this coupling, showing that in inverter-dominated grids, rapid AI load ramps alone — without any generator fault — can drive voltage depressions, RoCoF spikes, and system-wide instability.[16] The two trends compound viciously: the load that can vanish is growing, and the system’s ability to absorb its vanishing is shrinking. We are building larger and larger herds on softer and softer ground. The one genuinely hopeful element in this picture, developed in Sections 5 and 6, is that the same power electronics that make inverter-based loads volatile can, if deliberately controlled, make them into fast-acting stabilizers — grid-forming assets that provide synthetic inertia and respond within milliseconds. The physics that creates the problem also contains the solution; the question is entirely one of engineering intent and regulatory mandate.

Section 4: The Synchronization Problem and the Threat Matrix
We arrive now at the conceptual heart of the paper. Sections 1 through 3 established the empirical reality (a doubling series of gigawatt-scale disconnection events), the server-side mechanism (voltage-sensitive protection and automated restart), and the grid-side terrain (ordinary triggers, wide propagation, eroding inertia). This section synthesizes them into a single question: why do independently owned, competitively operated, geographically distributed datacenters behave as though they were centrally coordinated? And it answers that question by assembling the full threat matrix — the specific pathways by which synchronization converts individually rational behavior into systemic catastrophe. The synchronization problem is what makes the Compute Stampede a genuinely new category of risk rather than merely a bigger version of an old one.
4.1 The Synchronization Problem: Correlated Behavior Without Coordination
The datacenters that disconnected on July 22, 2026 were owned by different companies, competing fiercely for the same customers, sharing no operational coordination, and in many cases contractually forbidden from sharing the kind of information that would let them coordinate. And yet they behaved as one. This is the synchronization problem, and its causes are structural rather than conspiratorial. The AI datacenter industry is built on a startlingly narrow set of shared components. A handful of vendors supply the GPUs; a handful supply the server power supplies and their protection firmware; a handful supply the UPS systems and static transfer switches; a handful supply the orchestration software. Every facility monitors the same grid and applies protection thresholds derived from the same ITIC-style curves and the same conservative engineering culture. The homogeneity that makes the industry efficient — standardized, interoperable, best-practice hardware and software — is precisely what makes it dangerously correlated. When a common signal arrives (a regional voltage sag), a homogeneous fleet produces a common response (simultaneous transfer to backup), because they are, functionally, the same machine replicated thousands of times.
This is the software-monoculture problem long familiar from cybersecurity, transplanted into the physical layer of the power grid. In cybersecurity, a monoculture means a single exploit can compromise millions of identical systems at once. In the Compute Stampede, a monoculture means a single voltage event can trip millions of identical protection systems at once. The analogy is exact and the consequence is the same: homogeneity converts a local perturbation into a systemic one. Ali Zain Banatwala of the Independent Electricity System Operator described the behavioral reality with precision after the July 2026 event, noting that the facilities all made the same split-second decision within a few seconds of one another.[2] From the grid operator’s standpoint, the effect is indistinguishable from central coordination — and, as Section 4.2 explains, indistinguishable from the loss of a large generator, which is exactly the confusion that makes the phenomenon so dangerous to balancing authorities.
“We need to figure a way for these loads that are located next to each other to sequentially either disconnect or reconnect.”
— Ali Zain Banatwala, Independent Electricity System Operator (to TechCrunch) [2]
4.2 The Coordinated Droop Failure: When Loads Masquerade as Generators
The first entry in the threat matrix is what we may call the coordinated droop failure, and it is fundamentally a problem of misclassification. Grid balancing authorities operate a mental and computational model of their system in which large, sudden events are generator trips. The entire apparatus of frequency response — spinning reserve, governor droop settings, automatic generation control — is tuned to the signature of losing supply: frequency falls, and the system responds by injecting more power. But a mass datacenter disconnection is the mirror image: it is a sudden loss of demand, which makes frequency rise and voltage surge, and it requires the opposite response.[9] When 3 GW vanishes in thirty seconds, the event has the magnitude and speed of a multi-unit generation trip but the opposite sign, and it strikes a control system optimized for the other direction.
The danger is compounded because a load-loss event and a generation-loss event can, in their early milliseconds and depending on location, present ambiguous signatures to a control room that has never been trained to expect large load losses at all. NERC stated the historical baseline plainly: the grid has always planned for large generation losses but not for significant simultaneous load losses.[9] An operator who misreads the direction of an imbalance, or who is simply overwhelmed by the speed of a swing that a low-inertia grid renders faster than human reaction time, may take stabilizing action too slowly or, in the worst case, take action appropriate to the opposite contingency. The coordinated droop failure is the risk that the fleet’s synchronized behavior confuses the very balancing mechanisms that are supposed to contain it — that the herd, by moving as one, is mistaken for a stampeding bull when it is in fact a stampeding void.
4.3 Harmonic and Sub-Synchronous Interactions: The Resonance Threat
The second entry in the threat matrix operates not through discrete disconnection events but through continuous oscillation, and it is the threat that most alarmed the engineers who authored the Microsoft–OpenAI–NVIDIA study. Every switch-mode power supply and every grid-tied inverter injects small high-frequency distortions into the grid as a byproduct of its switching. Individually negligible, these distortions can, when produced coherently by a homogeneous fleet, aggregate into meaningful harmonic pollution. But the more insidious mechanism is resonance. As Section 2.1 described, large synchronized AI training jobs produce facility-scale power oscillations whose fundamental frequencies are set by the training loop — and those frequencies fall squarely within the sub-synchronous and low-frequency bands (roughly 0.1 to 20 Hz) where the power system harbors its own electromechanical resonances: inter-area oscillation modes, and the torsional shaft modes of large turbine-generators.[13][15]
The physical worry is that a training cluster large enough, oscillating at a frequency close enough to a grid resonant mode, could pump energy into that mode the way a child pumps a swing — small, well-timed pushes accumulating into large amplitude. The Microsoft–OpenAI–NVIDIA authors warned explicitly that such resonance, even if partial and intermittent, risks mechanical fatigue or shaft failure in large two-pole and four-pole turbine generators, and can produce voltage flicker and frequency-regulation problems in constrained systems.[13] This is a qualitatively different kind of grid threat: not a fault, not a disconnection, but a slow, resonant coupling between the rhythm of a computation and the mechanical resonance of a distant power plant. It is the reason the joint industry paper framed its call so urgently — and the reason grid-interactive buffering (Section 5.1) and oscillation limits in interconnection standards (Section 6) belong in any serious framework.
4.4 The Loop Effect: The Stampede That Feeds Itself
The third and most dangerous entry in the threat matrix is the loop effect, and it is the mechanism that separates a large disturbance from a catastrophic cascade. The logic is a vicious circle with four steps. A voltage disturbance triggers a wave of datacenter disconnections. Those disconnections, by removing load, cause voltage to surge and frequency to rise across the region. That surge is itself a voltage disturbance — of the opposite polarity, but a power-quality excursion nonetheless — which crosses the protection thresholds of additional facilities that had ridden through the first wave. Those facilities disconnect, deepening the imbalance, propagating the disturbance further, and recruiting still more facilities. Each turn of the loop enlarges the event that drives the next turn.
This is not a theoretical construction. It is what the instrumentation recorded on July 22, 2026: the grid “appeared to recover somewhat, but a short time later additional loads dropped off,” driving the surplus to its 3.49 GW peak.[2] The two-wave structure of the event is the loop effect caught in the act, and the only reason it terminated after two waves rather than propagating into a full cascade is that the initial 3 GW, though enormous, was still a modest fraction of PJM’s total load and the surviving system had enough margin to damp the second wave. The arithmetic of the future is what makes this the central threat. If datacenters are 6 percent of PJM load in 2024 and 24 percent by 2040, then the pool of facilities available to be recruited into successive waves grows fourfold, while the reserve margin available to damp each wave shrinks.[2] At some threshold of penetration, the loop stops converging after two waves and begins to diverge — each wave larger than the last — and that divergence is the anatomy of the first true compute-driven blackout. The loop effect is why the Compute Stampede is a systemic risk and not merely an operational nuisance: it contains, natively, the positive-feedback mechanism that cascading failures require.
Table 4. The Compute Stampede threat matrix — four coupled failure pathways from synchronized load behavior.
| Threat Pathway | Mechanism | Why Synchronization Makes It Systemic | Illustrative Evidence |
| Synchronization Problem | Homogeneous hardware/software fleet responds identically to a common grid signal | Converts a local perturbation into a fleet-wide, coordinated response with no actual coordination | Dozens of independently owned campuses disconnecting within seconds (July 2026)[2] |
| Coordinated Droop Failure | Mass load loss mimics a large generation trip but with opposite sign; confuses balancing mechanisms | Fleet moving as one presents a contingency the control room was never designed to expect | Grid “not historically” planned for simultaneous load loss of this magnitude[9] |
| Harmonic / Sub-Synchronous Resonance | Training-loop power oscillations (0.1–20 Hz) couple with grid electromechanical modes | Coherent fleet oscillation can pump energy into resonant modes; risks turbine shaft fatigue | Microsoft–OpenAI–NVIDIA warning on physical damage from harmonized frequencies[13] |
| Loop Effect | Disconnections cause voltage surge → surge triggers further disconnections → repeat | Provides the positive-feedback mechanism required for a cascade; enlarges with penetration | Two-wave structure and 3.49 GW peak surplus recorded July 22, 2026[2] |

Section 5: Regulatory, Operational, and Architectural Blind Spots
A systemic risk becomes governable only when institutions can see it, model it, and assign responsibility for it. The uncomfortable truth exposed by the 2024 and 2026 events is that, until very recently, the American electricity system could do none of these things for large computational loads. The datacenter fleet grew into a bulk-power-system-scale actor while remaining, in regulatory terms, an ordinary retail customer; while remaining, in operational terms, invisible to the control rooms whose stability it now threatens; and while remaining, in architectural terms, hidden behind commercial and contractual structures that actively obscured its physical volatility. This section maps those three blind spots — regulatory, operational, and architectural — because a solution that does not address all three will fail. The good news, developed at the end of the section, is that the regulatory blind spot in particular has begun to close with remarkable speed in 2025 and 2026.
5.1 The Interconnection and Standards Blind Spot
For the entire history of the North American Electric Reliability Corporation as a mandatory-standards body — a status Congress granted it in the wake of the 2003 Northeast blackout — its enforceable reliability standards governed generators and transmission owners. Loads were the responsibility of distribution utilities and state regulators, and the working assumption, entirely reasonable for a century, was that loads were passive: they consumed what the system delivered and posed no systemic reliability risk of their own. A 20 MW customer at transmission voltage was a rounding error; the idea that a single customer might drop 400 MW in twenty-five seconds, or that a fleet of customers might drop 3 GW in thirty, was simply outside the design basis of the entire standards framework.[8][11]
The 2024 event detonated that assumption, and the institutional response, once it began, moved quickly by the standards of electricity regulation. NERC established its Large Loads Task Force on October 8, 2024, charging it first with identifying the unique technical and operating characteristics of large loads and then with evaluating how to improve planning and operations processes.[7] The task force’s 2025 white paper, “Characteristics and Risks of Emerging Large Loads,” organized the risks across planning, operations, stability, power quality, security, and restoration, and — crucially — prioritized them, elevating ride-through, voltage stability, and oscillations into the high-priority cluster.[8][11] The keentel engineering analysis of the incident distilled the four questions that the standards community now had to answer: whether large loads should become NERC-registered entities; whether new reliability standards should be developed to define ride-through thresholds; what studies transmission operators should perform; and what, precisely, constitutes a “large load” — with a proposed threshold around 75 MW of aggregated sensitivity.[20]
The decisive move came in mid-2026. On July 16, 2026, in Docket No. RD26-7-000, the Federal Energy Regulatory Commission directed NERC to file new or modified mandatory reliability standards governing the integration of “computational loads” — a category defined broadly enough to encompass generative-AI datacenters, cryptocurrency mines, and other information-technology facilities — by December 31, 2026, and to propose registry criteria that would bring computational-load entities directly under the mandatory reliability framework, with a Phase II work plan due March 1, 2027.[20][23] FERC grounded the order in three NERC reports: the January 2025 incident review of the July 2024 event; a January 2026 review of twenty-six ERCOT crypto-load ride-through events finding losses of 17 to 95 percent of pre-disturbance consumption within milliseconds; and the June 2026 State of Reliability, which flagged large computational loads as a growing source of frequency and voltage instability.[20] For the first time, the behavior this paper calls the Compute Stampede would be governed by enforceable, auditable federal standards rather than the discretionary engineering culture of the datacenter industry.[23] The regulatory blind spot, in short, is closing — but the standards themselves remain to be written, and the analysis in this paper is offered partly as input to that writing.
5.2 The Visibility Gap: Flying the Grid Half-Blind
The second blind spot is operational, and it persists even as the regulatory one closes. Regional transmission operators run their systems using state estimators and dynamic models that represent the grid in near-real time — but those models were built for a world in which load was a smooth, predictable, aggregated quantity, and they do not represent the internal compute state of the datacenters behind the meter. A control-room operator in Valley Forge can see that 800 MW of load sits at a particular substation cluster; the operator cannot see whether that load is a synchronized training job about to drop 600 MW when it checkpoints, an inference fleet breathing gently with user demand, or a set of facilities whose protection logic is one voltage disturbance away from committing to backup power for the next four hours. The load’s dynamic character — the very thing that makes it dangerous — is invisible to the people responsible for system stability.[8][16]
This visibility gap has two consequences. In planning, it means the phantom contingency of Section 1 does not appear in the studies: the 1,500 MW response of 2024 was not represented in the models because the models had no way to represent customer-side protection logic, and so the event “was not anticipated by the BES operators.”[5] In operations, it means the grid is flown half-blind through exactly the regime where blindness is most dangerous — a low-inertia, high-penetration system whose fastest and largest disturbances now originate on the demand side, invisible to the instruments. The remedy, developed as Pillar 1 in Section 6, is proactive telemetry: real-time data pipelines from datacenter cluster managers and orchestration layers to RTO control rooms, so that the compute state that drives the electrical behavior becomes visible to the people who must stabilize it. The technology to do this exists — it is, after all, merely software talking to software — but the commercial incentives, data-sensitivity concerns, and standardization requirements have kept it from being built at scale. That is a governance failure, not a technical one.
5.3 The Power Purchase Agreement Paradox: How Green Contracts Hide Physical Volatility
The third blind spot is architectural and commercial, and it is the subtlest of the three. The hyperscalers have, admirably, become the largest corporate procurers of clean energy on Earth, signing power purchase agreements (PPAs) for vast quantities of solar, wind, and increasingly nuclear generation — Meta’s deal for the output of the Comanche Peak nuclear facility being one prominent recent example.[35] These contracts are genuine and valuable for decarbonization. But they are financial and accounting instruments, not physical-stability instruments, and herein lies the paradox: a datacenter can be, on an annual-net-energy basis, 100 percent matched to clean generation while remaining, on a millisecond-to-second basis, one of the most physically volatile and grid-destabilizing loads ever connected. The PPA describes where the electrons notionally come from over a year; it says nothing whatsoever about the ramp rates, the protection thresholds, the synchronized disconnection behavior, or the training-loop oscillations that determine the facility’s moment-to-moment impact on grid stability.
The paradox matters because it allows a genuine achievement (clean-energy procurement) to obscure an unaddressed risk (raw load volatility), and because it shapes public and regulatory perception. A facility celebrated in a sustainability report as a model of green computing may simultaneously be a hair-trigger participant in the next stampede, and nothing in the PPA framework surfaces that tension. Worse, the economics of clean PPAs and co-location arrangements — the subject of intense FERC attention in 2025 and 2026, including the December 2025 order requiring PJM to write transparent rules for loads co-located with generation — have accelerated the concentration of enormous loads in favorable-policy regions, deepening exactly the geographic clustering that Professor Le Xie’s group identifies as an amplifier of grid stress.[17][21] The lesson is not that clean PPAs are bad; it is that energy accounting and stability engineering are different disciplines, and that a governance framework focused on the former has allowed the latter to go unmanaged. Any serious standard must measure and regulate the physical behavior of the load directly, independent of where its energy is notionally sourced.
Underlying all three blind spots is a single economic engine that makes them urgent: the sheer scale and velocity of capital flowing into AI infrastructure. The four largest hyperscalers — Amazon, Alphabet, Microsoft, and Meta — guided to combined capital expenditures on the order of $725 billion for 2026, up roughly 77 percent from about $410 billion in 2025, with Amazon alone guiding to $200 billion; by the second-quarter 2026 earnings season, that trajectory had grown large enough to unsettle investors, with Alphabet’s shares falling 7 percent after it raised its capex forecast and analysts projecting Microsoft’s free cash flow turning negative for the first time in decades.[28][29][30] Whatever one concludes about the financial sustainability of this spending, its physical consequence is unambiguous: gigawatts of new, volatile, synchronized load are being poured onto the grid faster than the standards, the telemetry, or the buffering to manage them can be built. The blind spots are not static gaps to be closed at leisure; they are being widened, every quarter, by one of the largest and fastest capital deployments in industrial history. That is the context in which the engineering solutions of Section 6 must be evaluated — not as elegant options but as an urgent race against a construction curve.

Section 6: Engineering Solutions, Grid-Interactive Architectures, and the Compute Stampede Standard
The preceding sections deliberately accumulated a sense of gathering danger, because the danger is real and the trajectory is adverse. But the situation is far from hopeless, and this section turns decisively from diagnosis to remedy. The central and genuinely encouraging insight is that the same physical properties that make AI datacenters dangerous — their power-electronic interface, their millisecond controllability, their concentration of energy storage — are precisely the properties required to make them grid-stabilizing assets. A load that can disconnect in milliseconds can also, if engineered and mandated to do so, ride through in milliseconds; a facility hiding behind a bank of batteries can present the grid with a smooth, well-behaved profile instead of a hair trigger; a fleet synchronized by common software can be de-synchronized by common software. The engineering exists. What is missing is the mandate to deploy it and the standard to make it uniform. This section presents the three families of engineering solution — hardware buffering, software-defined staggering, and dynamic telemetry — and welds them into the proposed Compute Stampede Standard.
6.1 Hardware Buffering: Hiding the Datacenter Behind a Battery
The most direct engineering answer to the Compute Stampede is to interpose energy storage between the volatile load and the grid, so that the grid never sees the volatility at all. The concept is elegant in its simplicity: place the entire datacenter campus — servers, chillers, pumps, and all — behind a bank of batteries connected to sophisticated bidirectional power-conversion equipment, so that all the grid “sees” is one consistent, well-behaved load rather than the peaks and valleys of the individual components. This is precisely the architecture that the startup ON.Energy has been building, and the description its CTO gave TechCrunch after the July 2026 event is worth reproducing because it captures the transformation of role that this paper argues for throughout. Such a system lets a datacenter ramp AI training workloads up and down without bothering the grid, and — crucially — lets the facility absorb power fluctuations from the grid rather than fleeing them: instead of disconnecting when voltage dips, the buffered facility can charge its batteries from any excess power or dispatch power to servers when flow dips, and it can follow the grid’s lead within milliseconds, preventing the very sags and surges that caused the July 2026 problem.[2] ON.Energy reported installing a total of 3 gigawatts of such systems across four datacenter campuses — a figure that, not coincidentally, equals the magnitude of the July 2026 event itself.[2]
Utility-scale battery energy storage systems (BESS) are the workhorse of this approach, but they are not the only tool. Flywheels and supercapacitors excel at the very short timescales — milliseconds to seconds — where the sharpest transients live, and a well-designed buffer may combine technologies: flywheels or supercapacitors for the fastest ride-through, batteries for the seconds-to-minutes regime, and the facility’s existing backup generation for sustained outages. The academic literature has moved rapidly to formalize this: recent 2026 work on hybrid energy-storage systems with predictive control demonstrates source-side mitigation of AI datacenter power fluctuations, and a growing body of research reconceives the centralized datacenter UPS itself — historically the very device that executes the dangerous disconnection — as a grid-forming asset that could provide voltage and frequency support rather than merely fleeing disturbances.[34][35] The buffering solution, in other words, does not merely neutralize the datacenter as a threat; it converts the datacenter’s enormous embedded energy storage into a distributed stabilizing resource for the whole system. This is the engineering foundation for the “shock absorber” future invoked in the Conclusion.
6.2 Software-Defined Staggering: De-Synchronizing the Herd
If hardware buffering attacks the amplitude of the disturbance, software-defined staggering attacks its correlation. The core insight of Section 4 was that the danger lies not in any single facility’s behavior but in the synchronization of the fleet; it follows that breaking the synchronization is, by itself, a powerful mitigation — and that it can be achieved almost entirely in software, at negligible capital cost. The mechanism is the deliberate introduction of randomized or coordinated delays into the two moments that matter most: disconnection and, especially, reconnection. Rather than every facility in a region transferring to backup at the same instant a voltage threshold is crossed, staggered protection would spread those transfers across a window; rather than every facility racing to reclaim its GPU-hours the moment the grid appears stable, staggered recovery would spread reconnection across minutes according to a schedule that the grid can absorb. Banatwala’s prescription after the July 2026 event was exactly this: a way for co-located loads to sequentially disconnect or reconnect, so that grid operators can develop robust procedures in advance.[2]
Staggering must be implemented at two layers to be effective. At the firmware and protection layer, ride-through settings and disconnection thresholds can be diversified and delayed so that a common voltage signal no longer produces a common instantaneous response — the fleet stops being a single machine replicated thousands of times. At the orchestration layer, the Kubernetes-class cluster managers and job schedulers that drive the rebound can be made grid-aware: instead of relaunching every checkpoint and every training job the instant power returns, they can honor randomized or centrally coordinated restart windows, ramping compute load back onto the grid at a rate the system can tolerate. The Microsoft–OpenAI–NVIDIA team’s own recommendations point in this direction, calling for training algorithms that are asynchronous and power-aware and for standardized communication channels between datacenter operators and utilities.[14][15] The beauty of software-defined staggering is its cost structure: it requires no batteries, no flywheels, no construction — only firmware updates, scheduler logic, and, critically, the regulatory mandate to make the behavior uniform across an industry that will not otherwise de-optimize its GPU utilization voluntarily. This is the substance of Pillar 2.
6.3 Dynamic Demand Response and Real-Time Telemetry
The third solution family closes the visibility gap of Section 5.2 by building the missing nervous system between compute and grid. The vision is a real-time, bidirectional data interface connecting the hyperscale orchestration layer — the software that already knows, second by second, what every GPU cluster is about to do — to the RTO control room that must keep the system stable. In one direction, the datacenter streams its anticipated load steps to the grid operator: a large training job about to launch, a checkpoint about to drop 600 MW, a campus about to ramp. Forewarned, the operator can pre-position reserves and reactive support. In the other direction, the grid operator streams system conditions and, when necessary, dispatch signals to the datacenter: a request to hold a ramp, to shed a defined quantity of flexible load, or to delay a reconnection. The datacenter, with its buffering and its controllable workloads, becomes a fast, dispatchable, dynamic demand-response resource — arguably the most flexible large load the grid has ever had, if only its flexibility can be made visible and contractible.
This is where the emerging academic and industry consensus converges most strongly. The February 2026 Nature Energy paper by Colangelo, Coskun, Sivaram and colleagues, titled precisely “AI data centres as grid-interactive assets,” makes the affirmative case that these facilities can be operated as active grid participants rather than passive threats, providing flexibility services that improve rather than degrade system reliability.[35] Professor Le Xie and the Harvard Kennedy School Belfer Center team, in their February 2026 “watershed moment” analysis, similarly frame the moment as a fork in the road: the same load growth that threatens the grid could, with the right coordination and market design, become a source of flexibility and investment that strengthens it.[18] The technical requirements the industry itself has articulated — ramp-rate limits measured in megawatts per second, dynamic-power-range bounds, and oscillation limits within the critical 0.1–20 Hz band — are exactly the specifications a telemetry-and-dispatch interface would enforce.[15] Pillar 1 of the framework is the mandate to build this interface; Pillar 7 is the market and operational design that lets it deliver value.
6.4 The Compute Stampede Standard: Welding the Solutions Together
No single solution suffices. Hardware buffering without staggering leaves the reconnection wave unmanaged; staggering without telemetry leaves the operator blind to when staggering is needed; telemetry without enforceable standards leaves each hyperscaler free to optimize for GPU-hours at the system’s expense. The Compute Stampede Standard is the proposition that these solutions must be mandated together, uniformly, across every facility above a defined threshold, and integrated into the interconnection process, the reliability standards, and the market design as a coherent whole. The short-form logic of the standard is simple: require the load to ride through what the grid routinely throws at it; require it to disconnect and reconnect in a staggered, grid-absorbable manner when it must; require it to be visible to and dispatchable by the operator; and require it, wherever feasible, to contribute to stability rather than merely refrain from harming it. Section 8 states the standard as seven pillars. Before turning to them, Section 7 explains why this must be treated not as a niche engineering reform but as a matter of national infrastructure policy and security.

Section 7: Political, Economic, and National-Security Implications
It would be a category error to file the Compute Stampede under “power-quality engineering” and leave it there. The phenomenon sits at the intersection of the two most consequential build-outs of the present decade — artificial intelligence and the electricity system that powers it — and its mismanagement threatens not merely flickering lights but the reliability of critical infrastructure, the affordability of electricity for ordinary households, and the security of the grid against deliberate attack. This section argues that AI load behavior must now be treated as critical infrastructure in its own right, and that doing so requires the coordinated action of a specific set of actors: FERC and NERC, state governors and utility commissions, the utilities and RTOs, and the private companies — NVIDIA, the hyperscalers, and the equipment manufacturers — whose products and choices determine how the fleet behaves.
7.1 Reliability as a Public Good Under Strain
The most immediate political reality is that the grid serving 67 million people in the PJM footprint is under quantitative strain that the Compute Stampede both reflects and worsens. In July 2026, PJM’s capacity auction for the 2028/2029 delivery year tied a $16.4 billion record, of which data centers accounted for roughly $6.3 billion — a burden that, across four auctions, amounts to nearly $30 billion loaded onto ratepayers, according to the grid’s independent market monitor, who declared the repeated failure to secure enough supply “not an acceptable way to go forward.”[25] The supply-demand arithmetic is stark: PJM forecasts adding 5 to 7 gigawatts of datacenter demand annually while adding only 2 to 3 gigawatts of new supply through 2032, a structural deficit that the NRDC analysis warns could push the region below reliability standards as early as June 2027.[31] In this environment, PJM has proposed curtailing electricity to new large loads of 50 MW and above during grid emergencies beginning in June 2027 — a striking inversion of the century-old presumption that firm electricity service is unconditional.[26][27] The Compute Stampede is thus unfolding against a backdrop in which reliability margins are already thin, prices are already spiking, and the political legitimacy of loading datacenter costs onto households is already contested. A stampede-driven blackout in this context would be not merely a technical failure but a political rupture.
The affordability dimension deserves emphasis because it determines the politics. When the market monitor observes that consumers are on the hook for tens of billions in datacenter-driven capacity costs, and when a heat wave pushes PJM past a twenty-year peak-load record while AI load is still climbing, the stage is set for a backlash that could take the crude form of moratoria and outright connection bans rather than the refined form of the engineering standards this paper advocates.[22][36] The intellectually honest case for the Compute Stampede Standard is partly that it is the alternative to blunter instruments: a grid that can make datacenters well-behaved does not need to ban them.
7.2 The National-Security Dimension
Section 3.1 noted that a synchronized fleet disconnection triggered by a squirrel and one triggered by a saboteur look identical from the control room. That indistinguishability is the seed of the national-security argument. The Compute Stampede is, structurally, an attack surface: a mechanism by which a small, physically local, inexpensive action — inducing a voltage disturbance of the right depth and duration in the right location — can produce a large, systemic, geographically vast disruption. An adversary who understood datacenter protection thresholds well enough could, in principle, engineer the trigger deliberately, and the homogeneity of the fleet would do the amplification for free. The Microsoft–OpenAI–NVIDIA researchers approached the same territory from the physical side, noting that the resonance threat represents a way to cause physical damage to grid infrastructure — turbine shafts, specifically — through nothing more than the frequency content of a computation.[13] A vulnerability that can be triggered by accident can usually be triggered on purpose.
This reframing has a crucial policy consequence: it moves the Compute Stampede from the domain of voluntary industry best practice into the domain of mandatory critical-infrastructure protection, where cyber-physical defense is coordinated across the boundary between private operators and public authorities. The cloud-infrastructure security teams who defend the datacenters and the utility protection engineers who defend the grid have historically operated in separate worlds, with separate threat models, separate vocabularies, and no shared operational picture. The Compute Stampede lives precisely in the seam between them — it is a cyber-physical phenomenon in which software decisions produce grid-scale physical consequences — and defending against its deliberate exploitation requires unifying those two defensive communities. This is the substance of Pillar 5, cross-domain security coordination, and it is why the framework belongs in the same conversation as grid cybersecurity, not in a separate and lower-priority conversation about power quality.
7.3 Who Must Act
The distributed nature of the phenomenon means no single actor can solve it, and the coordination problem is itself part of the challenge. FERC and NERC hold the decisive lever — the mandatory reliability standards whose development FERC ordered in July 2026 — and the quality of those standards, which remain to be written, will largely determine whether the framework this paper proposes becomes reality or remains an academic exercise.[20][23] State governors and utility commissions control siting, retail tariffs, and the political economy of who pays, and their choices will determine whether datacenters are integrated intelligently or banned bluntly. Utilities and RTOs must build the telemetry, revise the interconnection studies, and operate the staggered-reconnection procedures. And the private sector — NVIDIA and the accelerator vendors whose power profiles set the amplitude of the swings, the hyperscalers whose orchestration software sets their correlation, and the UPS and PSU manufacturers whose firmware sets the protection thresholds — holds the engineering keys to every solution in Section 6. The encouraging fact is that the private actors have begun to move on their own: the very existence of the Microsoft–OpenAI–NVIDIA collaboration, and of companies like ON.Energy building campus-scale buffering, demonstrates that the industry recognizes the problem.[2][13] The role of policy is to convert that recognition from a competitive option, which laggards can ignore, into a uniform floor that everyone must meet.

Section 8: What Have We Learned? Three Findings and Seven Pillars
This paper has traveled from a flickering light bulb in a Chicago kitchen to the frontier of grid stability engineering and federal reliability policy. It remains to distill what the journey has taught. The lessons fall into three foundational findings about the nature of the problem and seven pillars that constitute the proposed Compute Stampede Standard. The findings explain why the old mental models fail; the pillars specify what must replace them.
The Three Findings
Finding One — Loads Are Now Generators. The first and most disorienting lesson is that gigawatt-scale digital loads behave, from the grid’s perspective, with the speed and systemic impact of major power plants. A 3 GW synchronized disconnection is, in magnitude and consequence, the equivalent of losing several large generating units at once — except that it happens faster than any generator trip, in the opposite direction from the contingency the system is designed around, and invisibly to the models. A century of grid engineering that treated the demand side as passive and the supply side as the locus of risk must be inverted: on the modern grid, the largest, fastest, most correlated instantaneous disturbances now originate on the demand side.[9][11]
Finding Two — The Speed Mismatch Is Fundamental. The second lesson is that there is a deep mismatch between the timescales of digital computation and mechanical grid response. AI loads change state in milliseconds; the grid’s mechanical and human response mechanisms operate in seconds to minutes; and the erosion of rotational inertia is widening this gap precisely as the loads causing it grow. No amount of faster human operation can close a gap this fundamental — the response must itself become electronic, embedded in the power-conversion equipment and the control software, operating at the same millisecond timescale as the disturbance. This is why buffering and grid-forming control, not merely better procedures, are essential.[16][32]
Finding Three — Synchronization Is the Systemic Multiplier. The third lesson is that software and hardware homogeneity across independent datacenter campuses creates a single point of systemic failure where none appears to exist. The industry’s efficiency-driven standardization is also its correlation, and correlation is what converts a manageable local disturbance into a systemic cascade through the loop effect. De-synchronization — diversity in thresholds, staggering in timing, coordination in recovery — is therefore not a marginal optimization but a primary defense.[2][13]
The Seven Pillars of the Compute Stampede Standard
Pillar 1 — Proactive Telemetry Integration. Establish mandatory, real-time, bidirectional data pipelines between datacenter cluster managers and orchestration layers on one side and RTO and balancing-authority control rooms on the other, so that anticipated load steps become visible before they occur and grid conditions become visible to the load. This pillar closes the operational visibility gap of Section 5.2 and provides the sensory foundation on which every other pillar depends. Without visibility, the operator cannot know when to invoke the other tools.
Pillar 2 — Mandatory Staggered Recovery Protocols. Enforce, at the firmware, protection, and orchestration layers, staggered and diversified windows for both disconnection and reconnection following any voltage or connectivity disturbance, so that a common grid signal no longer produces a common instantaneous fleet response and so that the rebound wave is spread across a grid-absorbable interval. This pillar directly addresses the synchronization problem (Finding Three), the rebound mechanism (Section 2.3), and the loop effect (Section 4.4), and it is the lowest-cost, highest-leverage intervention available, requiring principally software and mandate rather than construction.
Pillar 3 — Dynamic Grid-Edge Buffering. Require collocated energy storage — batteries, and where appropriate flywheels or supercapacitors — sized to absorb the full range of campus load fluctuations for the critical initial seconds-to-minutes, so that the grid sees a smooth, well-behaved load and the facility rides through disturbances instead of fleeing them. Where feasible, this buffering should be configured for grid-forming operation, converting the datacenter’s embedded storage into a stabilizing resource. This pillar addresses the speed mismatch (Finding Two) with an electronic response at the disturbance’s own timescale, and it is the technical foundation of the “shock absorber” transformation.[2][35]
Pillar 4 — Revised Interconnection and Ride-Through Frameworks. Update NERC reliability standards and IEEE interconnection standards to define mandatory fault-ride-through requirements for large computational loads, to regulate maximum allowable ramp rates (both dP/dt and dI/dt), and to bound oscillation magnitudes within the critical 0.1–20 Hz band — embedding these requirements in the interconnection process so that a facility cannot connect without demonstrating grid-friendly behavior. FERC’s July 2026 order directing NERC to file computational-load standards by December 31, 2026 is the vehicle; this pillar specifies the payload.[15][20][23]
Pillar 5 — Cross-Domain Cyber-Physical Security Coordination. Unify the threat models, operational pictures, and defensive practices of cloud-infrastructure security teams and utility protection engineers, treating synchronized load behavior as a critical-infrastructure attack surface subject to coordinated defense rather than as a mere power-quality nuisance. This pillar operationalizes the national-security analysis of Section 7.2 and ensures that a vulnerability triggerable by accident is defended against deliberate exploitation.
Pillar 6 — Regional Testing and Model Validation. Require periodic, regionally coordinated testing and high-resolution monitoring of large-load dynamic behavior — analogous to the disturbance-monitoring and model-validation regimes long applied to generators — so that the phantom contingency becomes a modeled, studied, and planned-for contingency, and so that interconnection studies represent customer-side protection logic rather than ignoring it. This pillar attacks the planning blind spot at its root: what is measured and modeled can be managed; what is invisible cannot.[5][8]
Pillar 7 — Market and Cost-Allocation Reform for Grid-Interactive Loads. Design market and tariff structures that price the physical behavior of the load directly — rewarding facilities that provide flexibility, ride-through, and stabilizing services, and allocating the costs of volatility to those who create it rather than to households — so that grid-friendly engineering becomes commercially rational rather than a competitive sacrifice. This pillar aligns the economic incentives with the physical requirements, and it addresses both the PPA paradox of Section 5.3 and the affordability politics of Section 7.1, ensuring the framework is durable rather than dependent on perpetual regulatory compulsion.[17][18][25]
Table 5. The seven pillars of the Compute Stampede Standard, mapped to the threats they mitigate and the actors responsible.
| Pillar | Primary Threat Addressed | Lead Actors | Cost / Leverage Profile |
| 1. Proactive Telemetry Integration | Visibility gap; phantom contingency | Hyperscalers, RTOs, NERC | Low cost (software); enabling foundation for all others |
| 2. Mandatory Staggered Recovery | Synchronization; rebound; loop effect | Hyperscalers, PSU/UPS vendors, NERC | Very low cost; highest leverage per dollar |
| 3. Dynamic Grid-Edge Buffering | Speed mismatch; amplitude of transients | Datacenter operators, storage vendors | High capital cost; converts threat into stabilizing asset |
| 4. Revised Interconnection / Ride-Through | Interconnection & standards blind spot | NERC, FERC, IEEE | Regulatory cost; sets the mandatory floor |
| 5. Cross-Domain Security Coordination | National-security attack surface | DOE, CISA, utilities, cloud security teams | Institutional cost; closes the cyber-physical seam |
| 6. Regional Testing & Model Validation | Planning invisibility | RTOs, NERC, transmission operators | Moderate cost; makes the contingency modelable |
| 7. Market & Cost-Allocation Reform | PPA paradox; affordability politics | FERC, RTOs, state commissions | Design cost; makes grid-friendliness rational |

Conclusion: From Vulnerability to Shock Absorber
The July 22, 2026 event did not cause a blackout. It caused ten minutes of flickering lights across a thousand-mile footprint, a voltage disturbance recorded on 1.4 million sensors, and — far more importantly — a moment of clarity about the trajectory the electricity system is on.[2][3] The event was a structural warning about the coupling of compute states and grid frequencies: a demonstration that the world’s computing infrastructure and its electrical infrastructure have become dynamically entangled, and that the entanglement is currently uncontrolled. The warning was legible precisely because the system held. Had the loop effect diverged rather than converged after two waves, this paper would be a post-mortem rather than a prevention plan. We have been given, in effect, a free lesson, and the entire question is whether we will pay attention to it before the tuition comes due.
It is worth restating, at the close, why this paper insists on the name “Compute Stampede.” The name is not decoration; it is analysis compressed into an image. A stampede is the synchronized flight of a herd, triggered by a small stimulus, amplified by reflexive imitation, dangerous in both its flight and its return, and — crucially — manageable not by eliminating the herd but by engineering its environment. Every element of that image maps onto the phenomenon and onto the remedy. The datacenters are the herd; their homogeneous protection logic is the reflexive imitation; the failed power line is the snapped twig; the rebound is the return; and the seven pillars are the fences, chutes, and staggered gates that let the herd move without trampling the system. “Correlated voltage-sensitive load rejection with uncontrolled reconnection dynamics” is what the phenomenon is; “Compute Stampede” is what makes it possible to think clearly about it, to communicate it to a governor or a CEO or a citizen, and to organize a response around it. Naming the danger well is the first act of governing it well.
The future this paper argues for is genuinely hopeful, and it turns on a single reversal. Today, the AI datacenter is the grid’s largest single vulnerability — a gigawatt-scale, millisecond-fast, synchronized load that flees at the first disturbance and returns in an uncontrolled rush. But the very properties that make it dangerous — its power-electronic interface, its embedded energy storage, its millisecond controllability, its software-defined behavior — are exactly the properties of an ideal grid-stabilizing asset. A datacenter buffered behind batteries, running grid-aware orchestration, visible to and dispatchable by the operator, and configured for grid-forming control is not a threat to be tolerated but a resource to be prized: a fast, flexible, distributed shock absorber that can ride through disturbances, damp oscillations, provide synthetic inertia, and follow the grid’s lead within milliseconds. The Nature Energy authors call these facilities grid-interactive assets; the Belfer Center calls this a watershed moment; the engineering community increasingly agrees that the same load growth that threatens the grid could, with the right design, strengthen it.[18][35] The transformation from vulnerability to shock absorber is not a fantasy. It is an engineering program with known components, blocked chiefly by the absence of a mandate to deploy them uniformly.
That mandate is now, for the first time, within reach. FERC’s July 2026 order directing NERC to write enforceable standards for computational loads by the end of 2026 opens the door; the quality of what walks through it is the decision before us.[20][23] The call to action of this paper is therefore addressed to all the actors whose coordination the phenomenon demands: to FERC and NERC, to write standards that embody the seven pillars rather than merely the least controversial of them; to state governors and commissions, to choose intelligent integration over blunt prohibition; to the utilities and RTOs, to build the telemetry and rewrite the studies; and to NVIDIA, the hyperscalers, and the equipment manufacturers, to convert their evident private recognition of the problem into a uniform public floor of grid-friendly behavior. The capital is flowing — three-quarters of a trillion dollars in a single year — and the load is being poured onto the grid faster than the safeguards to manage it.[28][29] The race is between the construction curve and the standards curve. We know how to win it. What remains is the mandatory, collaborative pivot — among hyperscalers, grid regulators, and power engineers — to make the datacenter a stabilizing asset before an uncontrolled stampede writes the first chapter of the first true compute-driven blackout. The lights flickered once, from Chicago to Miami, as a warning. Whether they flicker again as a catastrophe is, still, entirely within our power to decide.

Footnotes and Endnotes:
[1] Laila Kearney and Seher Dareen, Reuters (via U.S. News & World Report). “Massive Disconnect of Power Roils Largest US Electric Grid,” July 22, 2026. https://www.usnews.com/news/us/articles/2026-07-22/massive-disconnect-of-power-roiled-largest-us-electric-grid
[2] Tim De Chant, TechCrunch. “One Fallen Power Line Exposed a Growing AI Data Center Problem. Here’s How to Fix It,” July 25, 2026. https://techcrunch.com/2026/07/25/one-fallen-power-line-exposed-a-growing-ai-data-center-problem-heres-how-to-fix-it/
[3] Energy News Beat. “Data Center Alley Crisis Averted, But Sends A Huge Warning,” August 2026. https://energynewsbeat.co/electrical-generation/data-center-alley-crisis-averted-but-sends-a-huge-warning/
[4] Data Center Dynamics. “PJM Grid Hit by Voltage Disturbance After Data Center Load Abruptly Drops Offline,” July 2026. https://www.datacenterdynamics.com/en/news/pjm-grid-hit-by-voltage-disturbance-after-data-center-load-abruptly-drops-offline-report/
[5] North American Electric Reliability Corporation (NERC). “Incident Review — Considering Simultaneous Voltage-Sensitive Load Reductions,” January 2025. https://www.nerc.com/globalassets/our-work/reports/event-reports/incident_review_large_load_loss.pdf
[6] Data Center Dynamics. “Virginia Narrowly Avoided Power Cuts When 60 Data Centers Dropped Off the Grid at Once,” 2025. https://www.datacenterdynamics.com/en/news/virginia-narrowly-avoided-power-cuts-when-60-data-centers-dropped-off-the-grid-at-once/
[7] White & Case LLP. “NERC Tees Up Plan to Assess Grid Risks Associated with Data Centers,” 2025. https://www.whitecase.com/insight-alert/nerc-tees-plan-assess-grid-risks-associated-data-centers
[8] NERC Large Loads Task Force. “Characteristics and Risks of Emerging Large Loads,” White Paper, 2025. https://www.nerc.com/globalassets/who-we-are/standing-committees/rstc/whitepaper-characteristics-and-risks-of-emerging-large-loads.pdf
[9] American Public Power Association. “NERC Incident Review Examines Risks, Challenges Tied to Integration of Large Loads,” January 2025. https://www.publicpower.org/periodical/article/nerc-incident-review-examines-risks-challenges-tied-integration-large-loads
[10] Keentel Engineering. “Understanding Voltage-Sensitive Load Reductions,” November 2025. https://keentelengineering.com/nerc-voltage-sensitive-loads
[11] Keentel Engineering. “NERC Large Loads: Grid Reliability Risks Explained,” June 2026. https://keentelengineering.com/nerc-large-loads-grid-reliability
[12] Schneider Electric. “How Data Centers Can Support Grid Stability,” February 2026. https://blog.se.com/datacenter/2026/02/27/data-centers-grid-friendly-preventing-blackout-grids-stability-resilience/
[13] Esha Choukse et al. (Microsoft, OpenAI, NVIDIA). “Power Stabilization for AI Training Datacenters,” arXiv:2508.14318, August 2025. https://arxiv.org/abs/2508.14318
[14] The Register. “AI Giants Call for Energy Grid Kumbaya,” August 22, 2025. https://www.theregister.com/2025/08/22/microsoft_nvidia_openai_power_grid
[15] Microsoft Azure Compute Team. “Power Stabilization for AI Training Datacenters,” Microsoft Community Hub, October 2025. https://techcommunity.microsoft.com/blog/azurecompute/power-stabilization-for-ai-training-datacenters/4460937
[16] Prof. Aoife Foley (University of Manchester / Queen’s University Belfast) and Dr. Dlzar Al Kez. “Instability Risks from Programmable AI Load Ramping in Low-Inertia Grids,” SSRN / Meet the Author, May 2026. https://blog.ssrn.com/2026/05/18/a-closer-look-instability-risks-from-programmable-ai-load-ramping-in-low-inertia-grids-by-prof-aoife-foley-and-dr-dlzar-al-kez/
[17] Xin Chen, Xiaoyang Wang, Ana Colacelli, Matt Lee, and Prof. Le Xie (Texas A&M University / Harvard University). “Electricity Demand and Grid Impacts of AI Data Centers: Challenges and Prospects,” arXiv:2509.07218, 2025–2026. https://arxiv.org/abs/2509.07218
[18] Rachel Mural, Henry Lee, Minlan Yu, Le Xie, et al., Belfer Center for Science and International Affairs, Harvard Kennedy School. “AI, Data Centers, and the U.S. Electric Grid: A Watershed Moment,” February 10, 2026. https://www.belfercenter.org/research-analysis/ai-data-centers-us-electric-grid
[19] International Energy Agency (via AFP / Malay Mail). “Energy and AI” Report Coverage: Data Centres to Consume More Power than Japan by 2030, April 2025. https://www.malaymail.com/news/tech-gadgets/2025/04/11/ai-data-centres-to-consume-more-power-than-japan-by-2030-says-iea/172557
[20] POWER Magazine (Sonal Patel). “FERC Orders Mandatory NERC Reliability Standards for Data Center and Other Computational Loads,” July 2026 (Docket No. RD26-7-000). https://www.powermag.com/ferc-orders-mandatory-nerc-reliability-standards-for-data-center-and-other-computational-loads/
[21] Federal Energy Regulatory Commission. “FERC to Act on Large Load Interconnection Docket by June 2026,” April 16, 2026. https://www.ferc.gov/news-events/news/ferc-act-large-load-interconnection-docket-june-2026
[22] White & Case LLP. “DOE Directs FERC to Accelerate Interconnection of Data Centers,” October 2025. https://www.whitecase.com/insight-alert/doe-directs-ferc-accelerate-interconnection-data-centers
[23] Snell & Wilmer LLP. “FERC Moves to Bring Data Centers and Other Computational Loads Into the Mandatory Reliability Framework,” July 2026. https://www.swlaw.com/publication/ferc-moves-to-bring-data-centers-and-other-computational-loads-into-the-mandatory-reliability-framework/
[24] White & Case LLP. “FERC Orders Grid Operators to Promptly Revise or Justify Interconnection Rules for Data Centers and Large Loads,” June 2026. https://www.whitecase.com/insight-alert/ferc-orders-grid-operators-promptly-revise-or-justify-interconnection-rules-data
[25] Bloomberg (via Insurance Journal). “AI Bumps Power Cost 60% as Mega US Grid Fails to Hit Supply Goal,” July 15, 2026. https://www.insurancejournal.com/news/national/2026/07/15/877619.htm
[26] Network World (Prasanth Aby Thomas). “AI Data Centers in the US May Face Power Cuts Under PJM Reliability Proposal,” July 2026. https://www.networkworld.com/article/4202800/ai-data-centers-in-the-us-may-face-power-cuts-under-pjm-reliability-proposal.html
[27] Tim De Chant, TechCrunch. “Data Centers May Face Temporary Power Cuts to Prevent Blackouts on Largest US Grid,” July 28, 2026. https://techcrunch.com/2026/07/28/data-centers-may-face-temporary-power-cuts-to-prevent-blackouts-on-largest-us-grid/
[28] CNBC (Jordan Novet et al.). “Amazon, Meta and Microsoft Face Skeptical Investors This Week After Google Report Sparked Sell-Off,” July 28, 2026. https://www.cnbc.com/2026/07/28/hyperscalers-face-higher-capex-scrutiny-after-alphabet-report-panned.html
[29] Statista. “Big Tech’s AI Spending to Reach $760 Billion in 2026,” 2026. https://www.statista.com/chart/35046/capital-expenditure-of-meta-alphabet-amazon-and-microsoft/
[30] CNBC (Ari Levy). “Tech AI Spending Approaches $700 Billion in 2026, Cash Taking Big Hit,” February 6, 2026. https://www.cnbc.com/2026/02/06/google-microsoft-meta-amazon-ai-cash.html
[31] Chris Martin / ECIKS (citing NRDC analysis). “Northern Virginia Data Center Disconnect Causes 3 GW Power Loss on PJM Grid,” July 24, 2026. https://eciks.org/15648-northern-virginia-data-center-power-disconnect
[32] Lee Shaver, Union of Concerned Scientists. “Data Centers Are Changing the Grid. Our Energy Sources Should Evolve Too,” March 2026. https://blog.ucs.org/lee-shaver/data-centers-are-changing-the-grid-our-energy-sources-should-evolve-too/
[33] Data Center Knowledge (Uptime). “From Capacity to Chaos: How AI Data Centers Challenge the Grid,” May 2026. https://www.datacenterknowledge.com/uptime/from-capacity-to-chaos-how-ai-data-centers-challenge-the-grid
[34] Michigan State University / Sandia National Laboratories (NSF Grant 2408615). “Spatial Load Correlation in AI Data-Center-Dominated Power Systems,” arXiv:2606.13853, 2026. https://arxiv.org/pdf/2606.13853
[35] Philip Colangelo, Ayse K. Coskun (Boston University), Varun Sivaram, et al.. “AI Data Centres as Grid-Interactive Assets,” Nature Energy 11, 254–261 (2026). https://doi.org/10.1038/s41560-025-01927-1
[36] Startup Fortune. “AI Data Centers Have Pushed America’s Largest Power Grid to Its Breaking Point,” July 2026. https://startupfortune.com/ai-data-centers-have-pushed-americas-largest-power-grid-to-its-breaking-point/
[37] Morgan Lewis LLP. “Federal Regulatory Outlook for Electric Storage, QFs, and Inverter-Based Resources,” March 2026. https://www.morganlewis.com/pubs/2026/03/federal-regulatory-outlook-for-electric-storage-qfs-and-inverter-based-resources